Continuum, Apogee, and Setai offer distinct starting points for evaluating Miami Beach resale liquidity. The decisive comparison is not prestige alone, but transaction depth, marketing time, and evidence supporting the exact residence’s size, floor, view, and asking price.
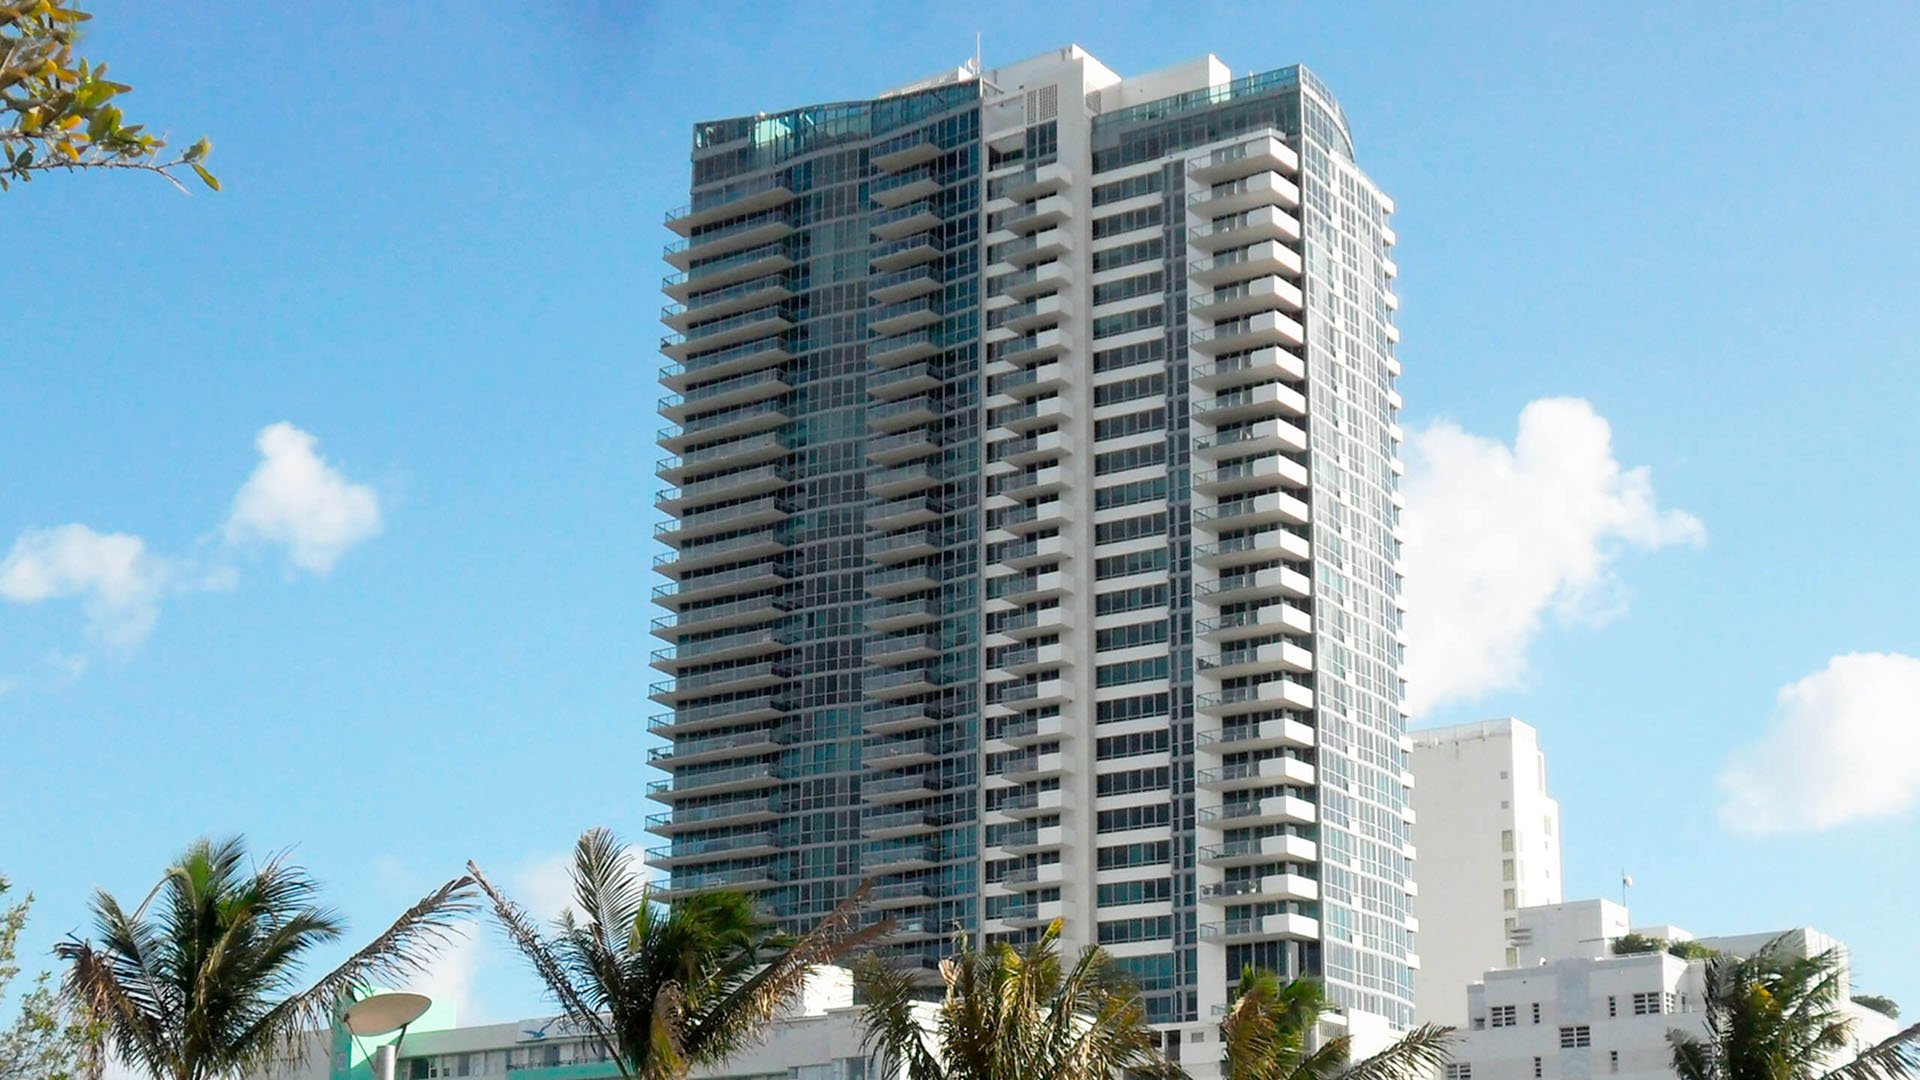
A Miami Beach address can command admiration without offering a predictable exit. For buyers balancing personal enjoyment with future resale flexibility, the question is not simply which building is best. It is which residence has the strongest evidence of demand at its specific price, size, floor, and view line.
Miami Beach luxury condominium sales rose 4.1% year over year in 2025. In the third quarter, South Beach was Miami Beach’s fastest-selling market, with the lowest inventory among beachside peers. Both are constructive market signals; neither establishes how quickly an individual residence will sell.
Continuum, Apogee, and Setai warrant distinct consideration rather than a numbered liquidity ranking. Their available transaction measures answer different questions. The essential distinction is between evidence of an active market, pricing power, and a shorter marketing period.
For a buyer seeking a substantial transaction history, Continuum on South Beach is a logical starting point. Its historical condominium transaction base includes 1,449 sales since 2002. Separately, Continuum North recorded nine closings in Q2 2024, the highest count within that comparison group.
That depth provides a foundation for examining comparable residences. It does not establish a present-day turnover rate, and the North tower’s quarterly activity should not be generalized to every residence across Continuum.
An undated building snapshot places Continuum at approximately $3,343 per square foot, 240 days on market, and 95% cash buyers. Treat those figures as context, not a current forecast. A high cash-buyer share describes the transaction mix; it does not guarantee an uncomplicated or rapid exit.
Before an acquisition, request recent closings in the same tower and comparable line. Isolate differences in interior area, elevation, condition, and view before using a building-wide price as a valuation anchor.
At Apogee South Beach, the available snapshot points to a different resale planning assumption. Pricing is approximately $3,464 per square foot, with roughly 400 days on market, compared with Continuum’s approximately 240 days in the same undated snapshot.
The contrast is meaningful but narrow. It supports a more patient marketing assumption for Apogee within that comparison-not a permanent judgment about every unit or market cycle.
A buyer drawn to Apogee should distinguish willingness to pay for the residence from confidence in its future sale timing. Before committing, examine the closest closed comparables and competing listings. A premium purchase can remain compelling for personal use while requiring a longer resale planning horizon.
Setai Residences Miami Beach belongs in the South Beach comparison, not South of Fifth. Its available building-level sample records 15 sales at a median $2,629 per square foot.
That sample provides a pricing reference and a defined transaction count. It does not include a comparable days-on-market measure, so it cannot establish that Setai sells faster than Continuum or Apogee.
For a specific residence, identify which transactions genuinely match its size, floor, and exposure. Buyers should also verify unit-specific rental permissions and financing eligibility rather than infer either from the building’s hotel association.
South Beach’s broader trailing-24-month transaction sample includes 733 qualifying arm’s-length condominium sales. The median residence measured 1,147 square feet, with a $1.295 million median sale price and a $1,125 median price per square foot.
Those figures describe transacted inventory across a broader neighborhood population. They do not prove that smaller residences sell faster, nor should they be applied directly to trophy buildings. The same sample includes a highest individual residential transfer of $21 million, illustrating the wide variation in transaction values.
For buyers comparing sizes, the more useful exercise is to examine both total purchase price and price per square foot within the same building. Ask whether recent buyers have closed on similarly sized residences at the contemplated price. A modest per-square-foot premium and a substantial increase in total purchase price pose different resale questions.
A higher floor may suit a buyer’s preferences, but height alone is not a demonstrated liquidity advantage. The available figures do not support a defensible floor-by-floor or stack-level resale hierarchy.
Evaluate elevation alongside the actual outlook from the principal rooms and terrace. During diligence, inspect sightlines, privacy, and potential obstructions rather than relying on a floor number or a broad view description.
For pricing, request paired comparisons wherever possible: similar layouts on different floors, or comparable elevations with different exposures. Account for renovation quality and transaction timing. Otherwise, a premium attributed to height may reflect another characteristic entirely.
The objective is not to avoid paying for elevation. It is to understand what the premium buys and whether comparable closings support it.
Indicative Miami Beach pricing places direct oceanfront residences at premiums of 40-80% over bay-facing or interior residences within the same submarket. That is a broad pricing relationship, not proof of faster resale.
Neighborhood ranges also require care. South of Fifth luxury residences span approximately $1,800-$4,500 per square foot, while Mid-Beach branded oceanfront residences span approximately $2,200-$5,000. Neither range establishes the appropriate price for a particular stack.
An unobstructed ocean outlook can be central to the purchase decision. The financial question is whether relevant transactions support its acquisition premium. Compare the residence with other direct-view offerings, then test the premium against alternatives with less expensive exposures. Do not assume that a more valuable view produces a shorter selling period.
The strongest shortlist can withstand unit-level scrutiny. For each finalist, request recent comparable closings, cumulative marketing time where available, asking-price changes, and the relationship between original asking and final closing prices. Review active competition separately from completed transactions.
Keep the time periods consistent. Continuum’s long historical sales base, a single quarter’s closings, and a neighborhood’s trailing-24-month median should not be blended into one liquidity score.
For an evidence-led starting point, Continuum offers historical transaction depth; Apogee warrants attention to the longer marketing snapshot; Setai provides a defined pricing sample without a comparable resale-time measure. The best fit is the residence whose purchase price, comparable sales, and expected holding period align with the buyer’s priorities.
For a discreet evaluation of Miami Beach residences through the lens of future resale, connect with MILLION.
If branded residences are on your mind — as a home or as an allocation — we would be glad to share what we are seeing, privately.
Begin a quiet conversationContinuum offers a historical base of 1,449 condominium sales since 2002. That makes it a useful starting point for comparable-sale research, not a guarantee of fast resale.
An undated comparison places Continuum at approximately 240 days on market and Apogee at approximately 400. That snapshot does not establish a permanent or unit-specific resale advantage.
The sample includes 15 sales with a median price of $2,629 per square foot. It provides pricing context but no comparable resale-time measure.
The available figures do not establish that relationship. The 1,147-square-foot median describes residences sold in a broader neighborhood sample, not marketing speed by size.
No floor-by-floor resale hierarchy is established by the available figures. Buyers should test elevation premiums against comparable closings and the residence’s actual outlook.
Indicative premiums range from 40–80% over bay-facing or interior residences within the same submarket. This broad pricing relationship does not demonstrate faster resale.
It describes the buyer mix in an undated snapshot. It does not guarantee sale timing or future transaction certainty.
Setai belongs in the South Beach comparison, not South of Fifth. Buyers should keep those geographic distinctions clear when selecting comparable sales.
No. Buyers should verify rental permissions and financing eligibility for the specific residence rather than infer them from a hotel association.
Review closely matched closings, cumulative marketing time where available, price changes, closing discounts, and active competition. Keep the building, unit characteristics, and measurement periods consistent.